

healthcare sustainability
U.S. COVID-19 Deaths: A Grim Few Weeks Coming Up By Randall Bolten


“The dumbest time to lie is when you know you’re going to get caught.” (great advice from an old mentor)
And yet, that’s the trap that some of our elected officials are falling into, and continuing to dig themselves deeper. They are saying that (a) the pandemic is under control, (b) the spike in new cases is due to aggressive testing, (c) death rates are dropping, and (d) since the people getting infected by COVID-19 in the U.S. are getting younger and younger, there’s less reason to worry. These assertions range from misleading and cruel to downright false. And we have not yet seen the consequences of the latest surge.
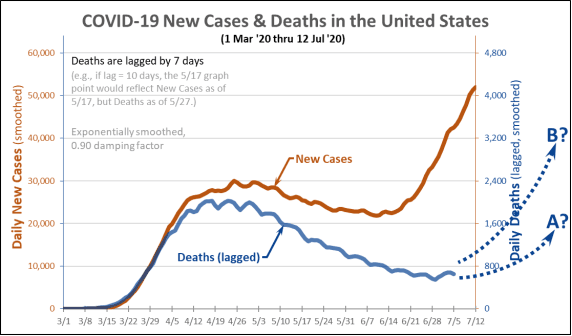
To get a sense of what the summer may bring, consider the following graph, showing daily new cases on the left-hand vertical axis, and deaths on the right-hand axis. (Note that the axis scales are set such that at equal horizontal levels, Deaths are equal to 8% of New Cases – e.g., 2,400 vs. 30,000.) Also, the Deaths curve is lagged by 7 days, so that for any New Cases datapoint, its corresponding Deaths datapoint reflects the level of deaths 7 days later.
We can learn the following from this graph:
(1) There is a clear relationship between new cases and deaths. The 7-day lag creates a near-perfect fit between the New Cases and the Deaths curves, up through early April. The decline in lagged deaths then tracks the decline in new cases, although the bottoming-out in lagged deaths in late June suggests that the cases-to-deaths lag time has stretched from one week to more like 3-4 weeks.
(2) The death rate is declining. At the first peak in early- to mid-April, lagged deaths equaled about 7% of total cases. After that first peak, the Deaths curve declined more rapidly than the New Cases curve. There’s plenty of evidence that the average age of Americans diagnosed with the virus is coming down, and that age is a mortality factor. It’s also clear that in the last several months care providers all over the world have learned a lot about caring for the most serious cases and about preventing death, and this has certainly lowered the death rate.
(3) The lag is getting longer. As noted above, the Deaths curve seems to have leveled off and perhaps has seen a small upswing over the last week or so. The New Cases curve showed that same characteristic in early June, before the dramatic upsurge we’ve seen over the last 3-4 weeks. The most likely explanations for the lengthening of the lag time are that we are diagnosing and reporting cases earlier, and that we are doing a much better job of keeping people alive.
So yes, there is a clear relationship between new cases and subsequent deaths. But with a 3-4 week lag between diagnosis and death, we have not yet seen the mortality consequences of the huge upsurge we’ve seen in the last few weeks. The broken lines at the right of the graph are possible extrapolations of the Deaths curve – curve A seems like a best-case scenario, but the results could be as heartbreaking as curve B.
Even assuming a future case fatality rate as low as 2% – the U.S.’s total rate since the beginning of the pandemic is still over 4% – we face the prospect of several weeks with daily death counts of 1,000 or more. At this point, it’s hard to imagine the summer ending with fewer than 200,000 total COVID-19 deaths in the U.S. The U.S. is in for a sad and difficult summer, and I wonder how these elected officials will happy-talk their way out of that.


